Internship
Brookhaven National Laboratory
I was fortunate to be selected for Brookhaven's High School Research Program: six weeks at a U.S. Department of Energy national laboratory, from July 6 to August 14, 2026, the summer between my junior and senior years.
Institution
Brookhaven National Laboratory
Program
High School Research Program (HSRP)
Timeline
July 6 – August 14, 2026 · six weeks
Context
About the program
Brookhaven National Laboratory is a U.S. Department of Energy research lab, home to facilities behind several Nobel Prize winning discoveries.
The High School Research Program (HSRP) is a competitive six-week summer program that pairs students with Brookhaven's scientific, engineering, and technical staff for hands-on research, ending with a poster session or oral presentation.
The research
The optical oven
A magnifying glass on a sunny day brings light to a point hot enough to scorch paper. This furnace does the same thing with a different light and a different optic. The light is a 750 W infrared halogen bulb. In place of a lens there is a mirror shaped like an egg, which is useful because light leaving one point inside it all lands on one other point. Put the bulb at the first point and everything it emits arrives at the second. That second point is the hot spot, where the lamp is rated to reach 1200 °C with no heating element and no contact. The formal name is an ellipsoidal reflector furnace, or optical oven.
My mentor, Dr. Kenneth Evans-Lutterodt, works at NSLS-II, Brookhaven's National Synchrotron Light Source II, which produces x-ray beams used to work out what a material is made of and how its atoms are arranged. He wants to run those measurements while the sample is hot, to see how a material changes as its temperature goes up.
A conventional furnace is the wrong tool for that, because its walls would block the beam and it would heat everything around the sample along with the sample. A spot of focused light heats the sample and leaves the x-ray path clear. On the poster the light converges from above and the x-rays cross sideways.
The problem
You cannot find the hot spot by looking
Nobody knew where the hot spot was, how wide it was, or how hot it got. A furnace that is slightly out of alignment still puts out light and still heats things, so nothing warns you that the sample is sitting off the focus.
Nor can you find the spot by eye, because most of what the lamp emits is infrared, which is invisible, and the part you can see is far too bright to look at. Something has to go into the beam and report back.
That comes down to three questions, each with its short answer.
Where is it?
The mirror’s geometry says where the focus should be. But the bulb is not a perfect point, the mirror is not a perfect egg, and the alignment is never exact, so the real focus is not the drawn one. The real one is where a sample has to sit.
Answer. Found, and used. The indium sat at the point the map picked out.
How big is it?
A sample has to fit inside the hot region, or one edge cooks while the other stays cool. My mentor works with pieces around 5 mm across, so the question is whether the spot is at least that wide.
Answer. At least 5 mm across, from the whole sample changing at once. I did not measure a width off the map.
How hot does it get?
Any experiment run on this furnace sets a lamp power and needs to know what temperature that produces at the sample. Nothing on the lamp tells you, because the supply is set in volts and amps, never in degrees.
Answer. At least 156.6 °C at the focus at about 250 W. The exact temperature, and the size of the probe’s offset, are still open.
The rig
What the setup is made of
The lamp, a probe, a moving stage, two cameras, and the code that drives them.
The bulb is a commercially available part, run from a 1000 W DC supply. Cooling air moves through the light source while the lamp is on, to keep the structural materials around it from overheating.
- The probe. A type-K thermocouple, which is two different metals joined at a tip. The junction puts out a small voltage that depends on its temperature. A Moxa reading device turns that voltage into a number the computer can store.
- The stage. Three motors, one per axis, driven by a Newport ESP 302 motion controller. Give the controller a position and it goes there, so the probe sits where the code says rather than where a hand left it.
- The code. Python. Move to a position, read the thermocouple, write down both, move to the next one, and keep going until the list of positions runs out. After a full scan, my mentor made the color-coded temperature maps from the readings. Before turning the lamp up, I ran the whole thing once at low power, motors, thermocouple and code together, to see that it worked as one piece.
- The cameras. Two Prosilica GT cameras, each looking through a microscope and connected to a computer, pointed at the sample from different angles. The setup stays covered while the lamp is running, so the sample gets watched on a screen from outside the light's line of sight as the power goes up.
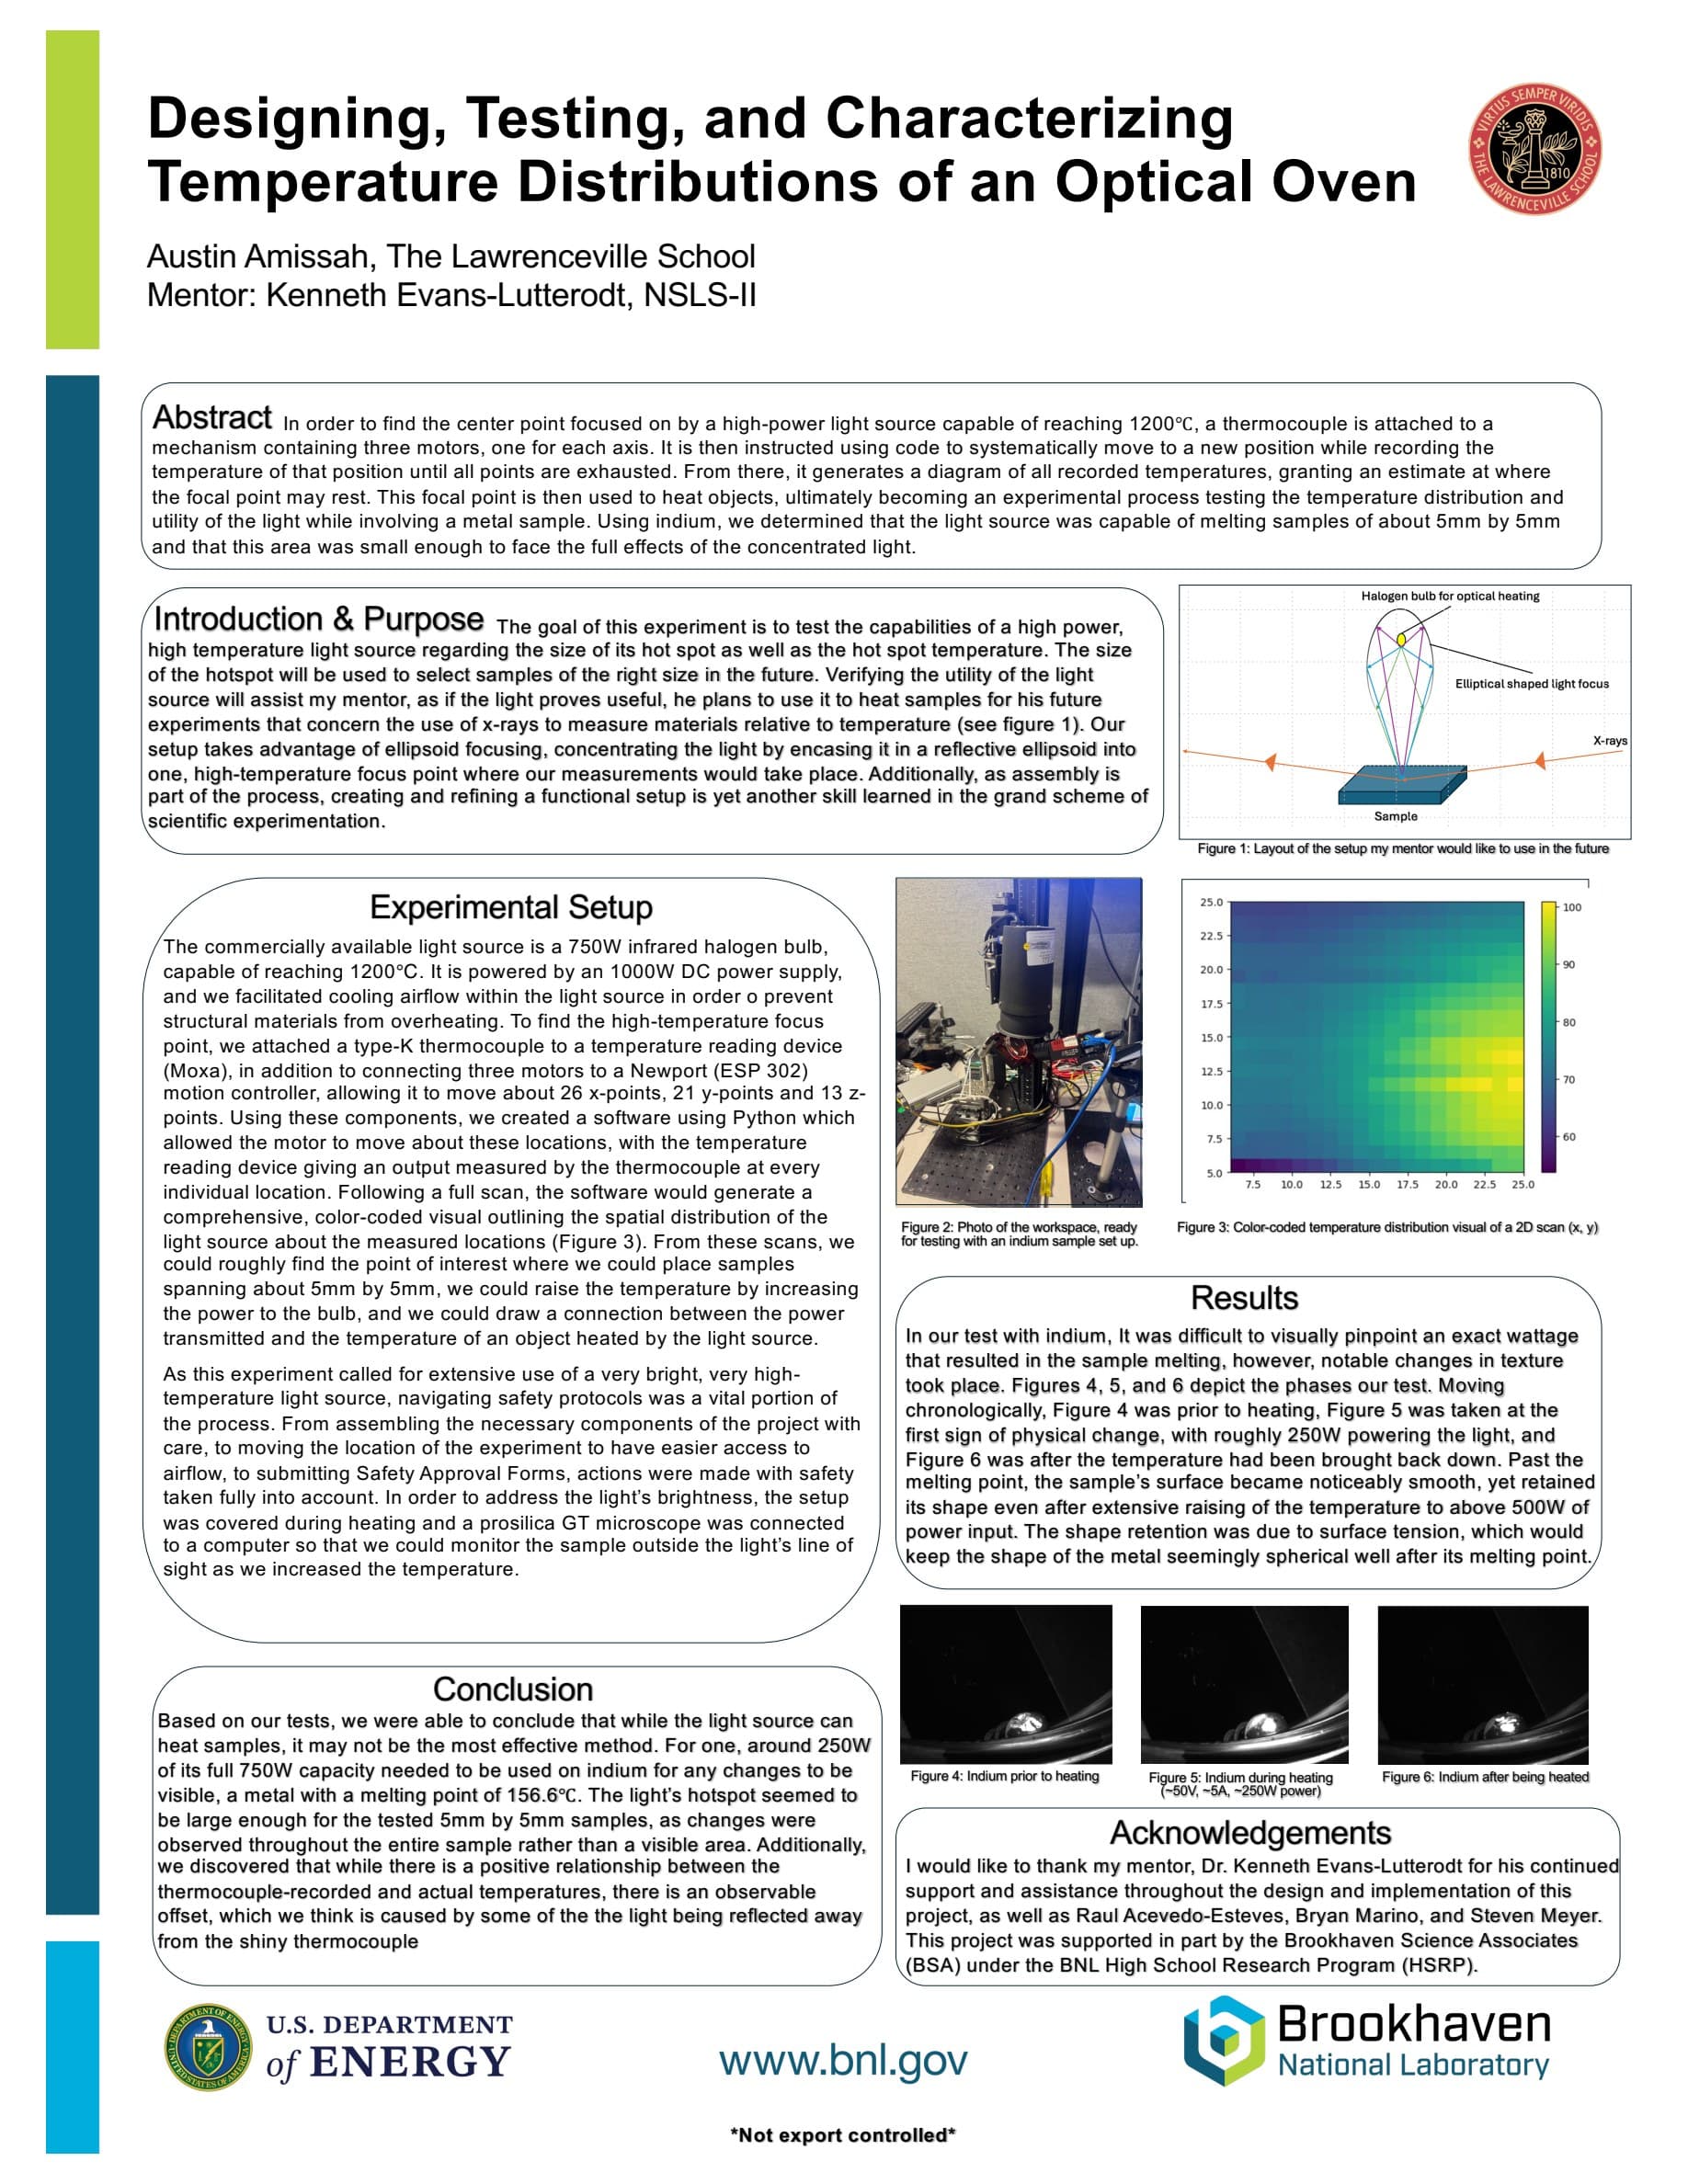
The maps my mentor made from the scans are the reason for scanning rather than taking one reading. A single number tells you the probe was hot, while a grid of numbers tells you where the hot region sits and how quickly the reading falls off toward the edges. On the poster the hot region shows up as one bright patch off to one side of the scanned square rather than at the center, and finding that patch is how the focus gets located.
That map covers a 20 mm square, 5 to 25 mm on each axis, sampled as a 26 by 21 grid, so the steps are 0.8 mm along one side and 1 mm along the other. Repeated at 13 heights, the same grid lets the beam be followed up and down as well as across. Because each 26 by 21 pass took a little over an hour, the full scan at 13 heights ran overnight with the lamp turned low.
I ran the scan at about 50 W, far under the lamp's 750 W, to protect the probe while still bringing out the shape. The probe read about 100 °C at the hottest point. So the map fixes where the beam lands and what shape it is, but not the temperatures the lamp reaches once the power goes up.
The probe is what the motors carry. Once the map is made the probe comes off and the sample goes on in its place, so the sample ends up sitting where the readings were taken. That swap is also why the probe and a sample are never in the light at the same time.
A lamp this bright and this hot makes safety protocol a large part of the setup work. We moved the experiment to a spot with easier access to airflow and submitted Safety Approval Forms, and once an inspector came through we got the go-ahead. A sheet of plexiglass wrapped in aluminum foil went up between the lamp and the room, with the microscope set back from it.
A change of plan
What I planned, and what happened
I went in planning to measure temperature with melting points. A thermocouple in the beam blocks the light and heats up on its own, and a pyrometer needs the sample's emissivity, which changes from material to material. Melting points sidestep both, because they are fixed physical constants and a solid turning liquid is unmistakable on camera. Enough metals at enough lamp settings would add up to a curve from power to temperature.
That is not what the six weeks turned into. Programming the scanning rig, helping assemble it, and getting the motors, the probe and the computer to work together reliably took much of the time. The scanning itself, once it worked, was quick, but by the time the poster went to print the only metal I had melted was indium, which melts at 156.6 °C.
The poster went in a few days before the session, and in the days between I tried melting other metals. Tin melts at 231.9 °C and went smooth at about 350 W. Zinc melts at 419.5 °C and went smooth at about 600 W. Those two settings are from memory rather than a log. At the lamp's full 750 W, aluminum, which melts at 660 °C, did not melt.
Three melts and one metal that stayed solid are not a curve from lamp power to temperature. What there is instead is a working way to find the focus, a map of the beam's shape around it, a lower bound on how wide the hot spot is, and a direction for the probe's error.
Results
What I found
I found the focus and put the sample on it
Scan the region, find the bright patch, take the probe off, put the sample where the probe was. The indium sat where the map said the focus is, and that loop is what the next person repeats.
The hot spot is at least 5 mm across
Because the indium, about 5 mm by 5 mm, changed all over rather than in one visible area, the hot spot is at least as wide as the sample. I did not measure a width off the map, so that bound is all I have, and it is enough for the x-ray work, which needs a sample that fits inside the hot spot.
The indium melted at about 250 W
The indium’s surface went smooth and stayed smooth at around 250 W of the bulb’s 750, about 50 V at 5 A on the supply. That is most likely the melt, though the exact wattage could not be pinned down by eye. The melt anchors one real temperature, since it means the sample at the focus reached at least 156.6 °C at about 250 W. Melting the lowest-melting metal on the bench took a third of full power, so this lamp can heat samples but may not be the most effective way to do it.
The thermocouple reads low
The probe reads below the real temperature. The likely cause is its own shine, because a polished thermocouple reflects away some of the light that is supposed to be heating it. The direction is all I have. Because the probe comes off the stage before the sample goes on, the two were never in the light together, and I could not measure the size of the gap.
One thing I did not expect was that past its melting point the indium held its shape. Surface tension keeps a small bead of liquid metal roughly spherical, the way a drop of water stays round on a leaf, so the sample looked much the same after melting as before, only smoother. Taking the power above 500 W did not change that. There was no moment to point at, which is why the evidence is a change in texture rather than a puddle.
That leaves the 250 W figure resting on my judgment of when the surface changed, which two people watching could place at different moments. Three things would replace the judgment with a measurement: step the power in fixed increments and hold each step; use a shape whose change cannot be missed, such as a wire bridge that sags or a cube whose corners round off; or let the camera catch the glare that comes off a liquid surface.
The standard
What has to be right for the numbers to be useful
The output is not one temperature reading. Because the group keeps the rig and the code, and other people there use them to set up their own experiments, the work has to hold up without me there to explain it.
For the numbers to be worth anything to the next person, four things have to be true:
- Measured from a known point. “The temperature 2 mm out” means something only if it is 2 mm from a place someone else can find. So the focus has to be found and described well enough to find again.
- Repeatable. Move the stage away, bring it back, and the reading should come back too. Without checking that, a map of the hot zone could just as easily be a map of the positioning error.
- Tied to a known reference. Indium's melting point is a published physical constant rather than something I measured, so it is a number someone else can check without repeating my work. Tying the lamp's power setting to it is the loose part, because the wattage where the sample melted could not be pinned down by eye.
- Reported with its uncertainty. A temperature with no error bar is hard to plan around, because you cannot tell how much margin you have.
None of this is complicated on its own. It is just slow, and the setup work, not the taking of readings, is where much of the six weeks went.
One part of it is not specific to this furnace. Put a bare metal thermocouple into concentrated light, read it as the sample temperature, and it will read low, because a polished probe reflects away part of what is meant to be heating it. The reading still tracks the real temperature, so it is usable. But it is a probe temperature, not a sample temperature.
What transfers
What the next person can use
Move the bulb, swap the mirror or knock the stage, and the map changes. It describes this furnace on the days I scanned it and nothing else, so the map itself does not carry over to anyone else's bench. The method carries over: motors, a probe, the scan code, and a melting-point check. So do three things that turned up along the way. A melt can announce itself as a change in surface texture rather than a puddle, a shiny probe reads low, and scanning at low power gives shape and place without putting the probe at risk. Any lamp like this one has to be characterized before it is useful, and the method is a repeatable way to do it.
The rig and the code stayed with the group at Brookhaven. The code is not public at this time.
What would come next is a calibration. Indium, tin and zinc are three rungs of a ladder of real temperatures against lamp power, and the aluminum that stayed solid at 750 W marks where the ladder ends. More metals with spaced melting points below aluminum's, at the same spot, would fill in the rungs between, which is what the map is missing, and give a measurement of how far the probe reads low at each rung. The probe's error belongs to the probe, not the sample, so it stays the same whichever metal is on the stage. The samples should be alike in size and finish, with shiny ones roughened first, because a bright surface reflects light away the way the probe does and sits cooler at the same power. A probe coated dull, or a pyrometer reading the sample directly, would remove the reflection at its source. And feeding a sample sensor back to the power supply would let someone set a temperature instead of a wattage.
The poster
Designing, Testing, and Characterizing Temperature Distributions of an Optical Oven
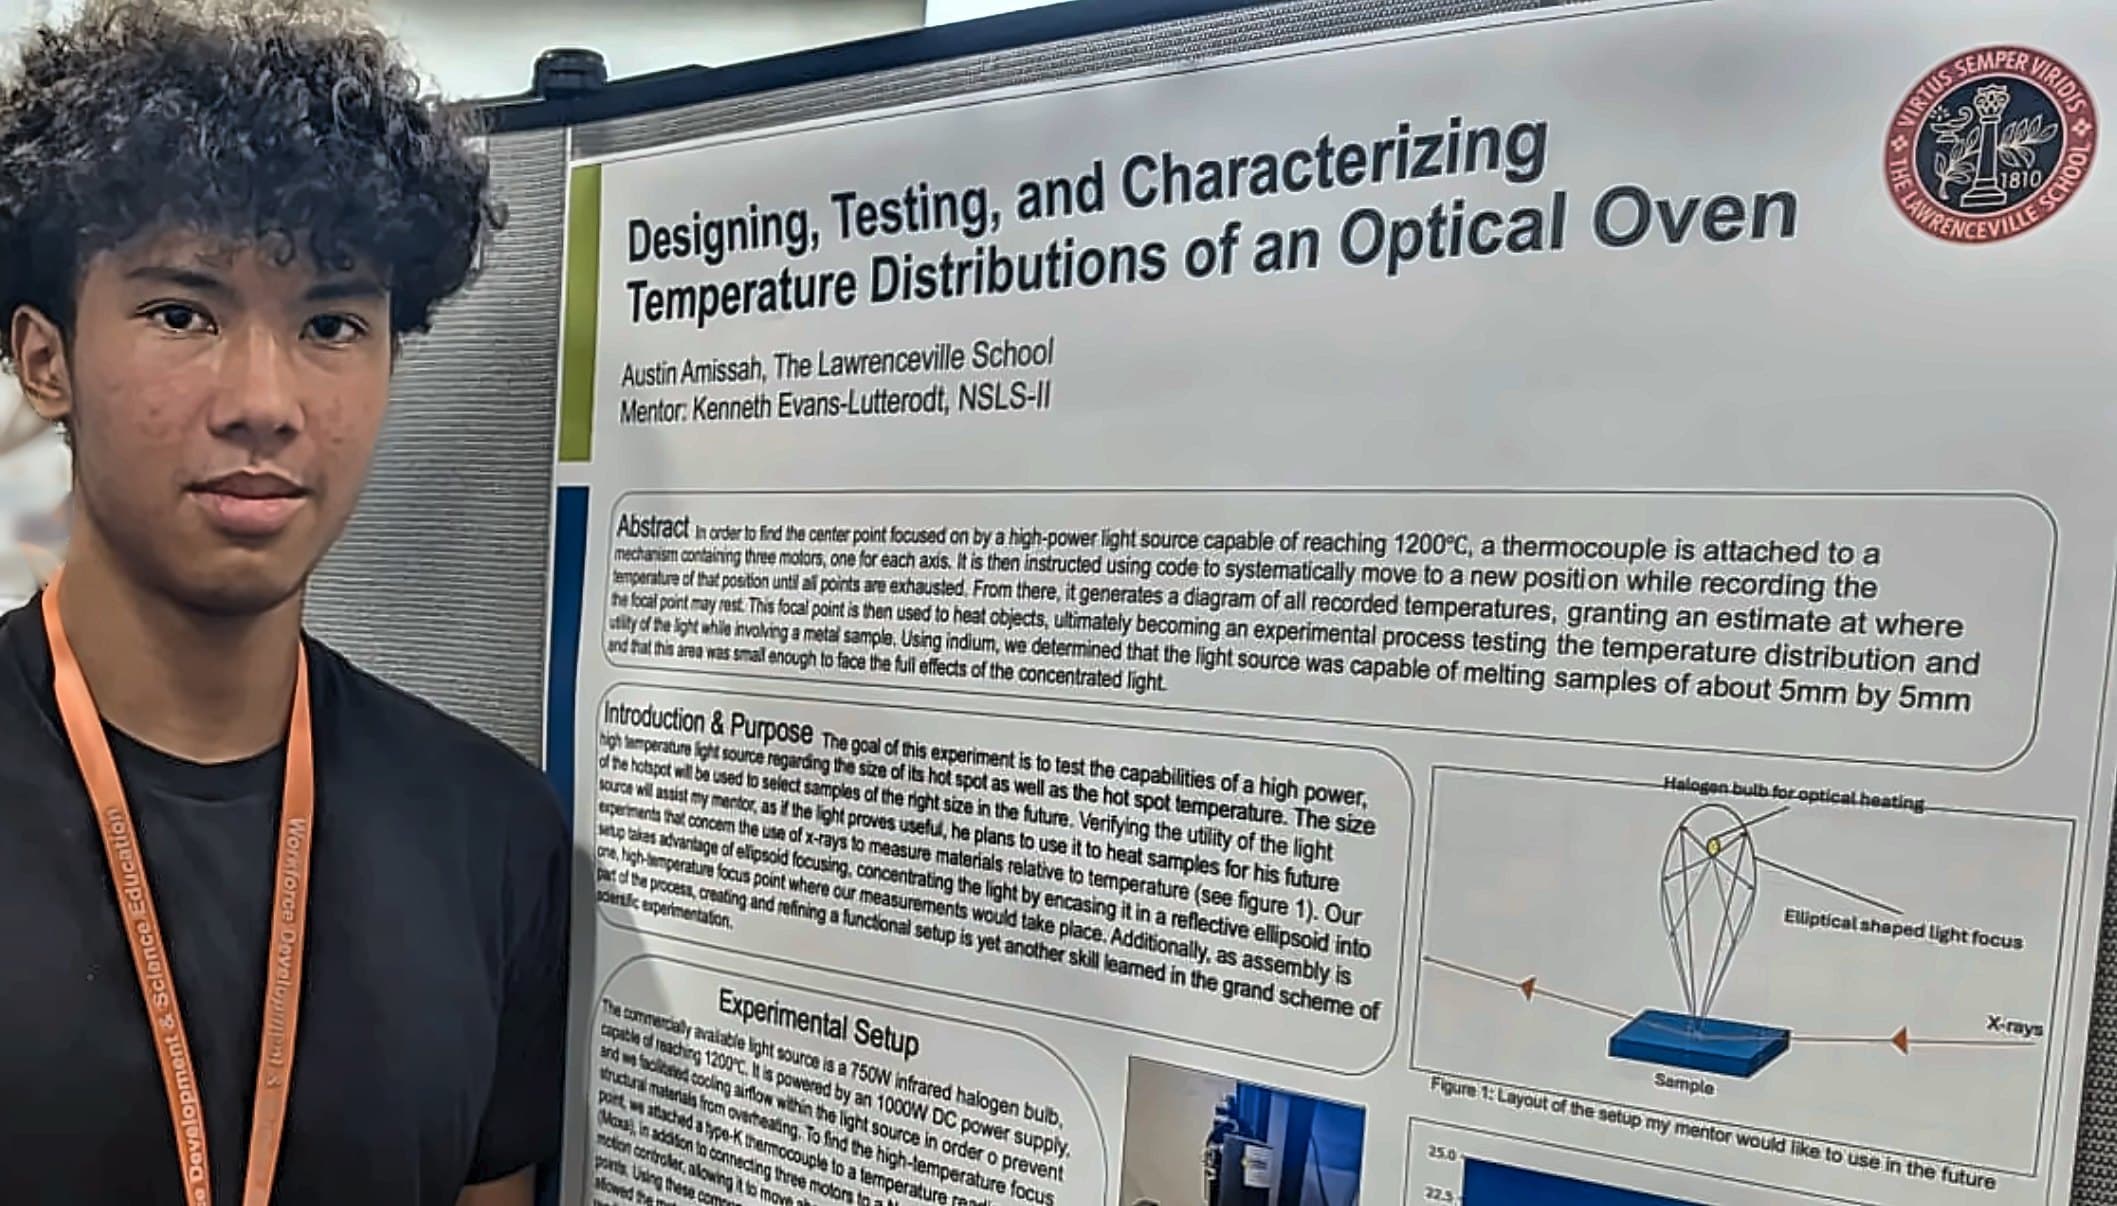
Presented at the poster session on August 14, 2026, the last day of the program.
Thanks
To my mentor, Dr. Kenneth Evans-Lutterodt
The project was designed and implemented with my mentor, Dr. Kenneth Evans-Lutterodt of NSLS-II, and I want to thank him here.
He gave me a project that required much of me. Every suggestion I made, he took seriously and acted on. He was patient with me. I have learned so much from him, and I now have an idea of what research looks like.
Thank you also to Raul Acevedo-Esteves, Bryan Marino and Steven Meyer, who helped assemble the setup, handle the safety paperwork, and move the experiment to a spot with cooling airflow.
Supported in part by Brookhaven Science Associates under the BNL High School Research Program.